



回撤的算术:为何亏损50%需要盈利100%才能回本
亏损与回本的计算基数并不相同。由这一事实出发:回本比例表、收益顺序风险,以及50%强制平仓规则所处的位置。
发布于 2026年8月12日阅读 8 分钟暂仅英文版
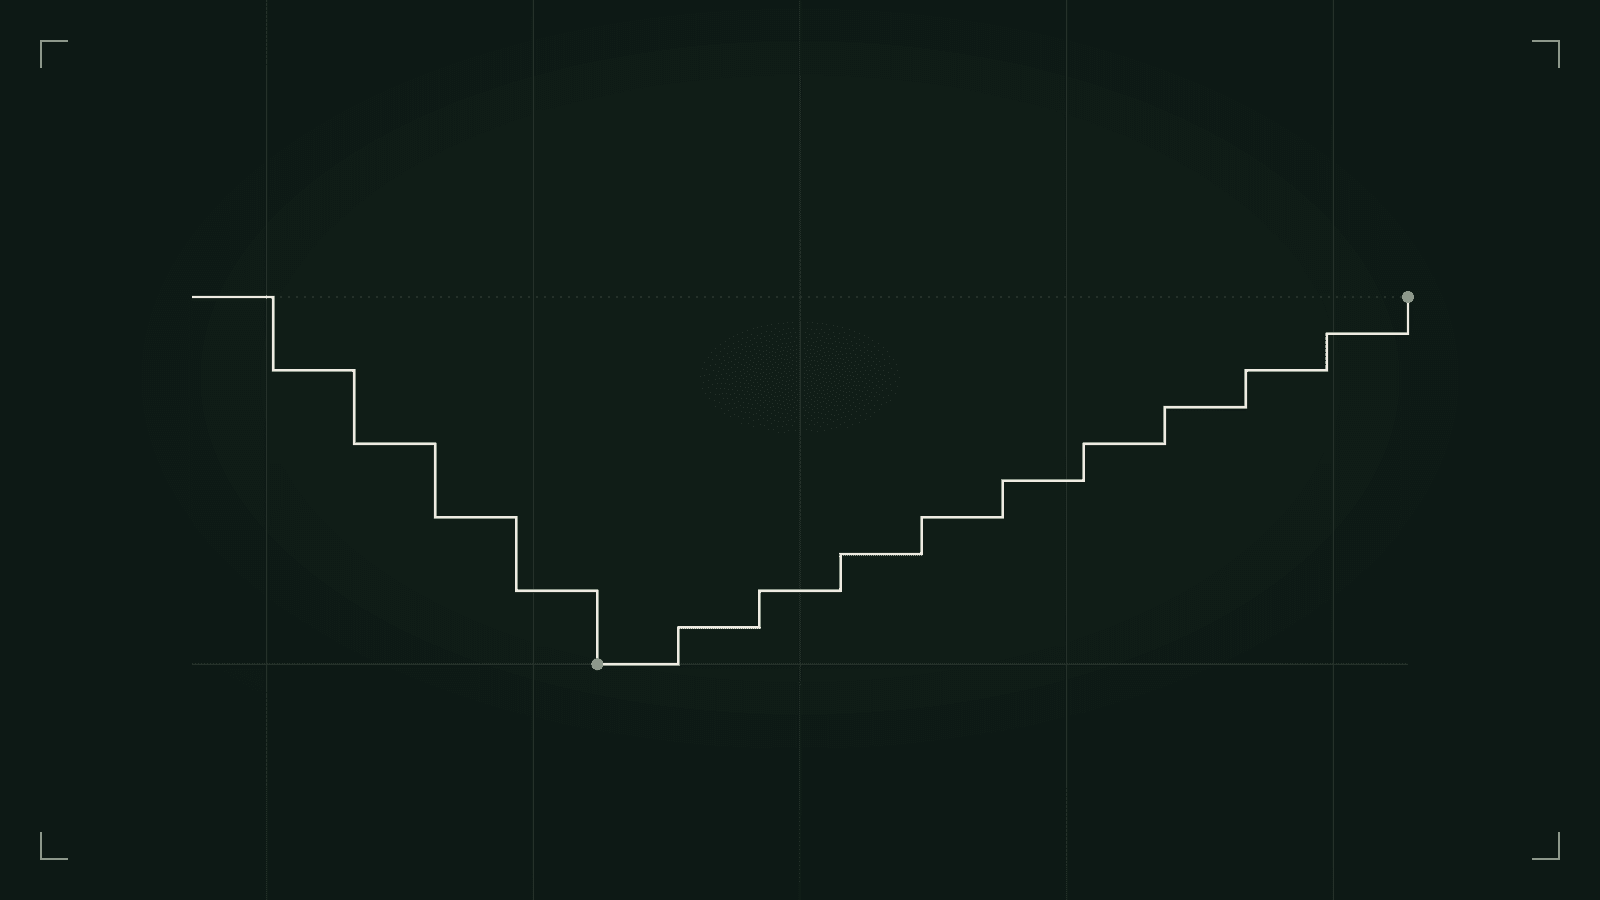
Lose 10% of an account and you need 11.1% to get back to even. Lose half and you must double what remains. Nothing in that sentence involves discipline, conviction or skill — it is division. This article walks through the arithmetic of drawdown and recovery: the table every risk plan quietly stands on, why the order of your trades changes the path more than the destination, how leverage compresses the timescale, and where European margin rules step in front of the mathematics.
The recovery table
A drawdown is measured against the balance you started with; the recovery that undoes it is measured against whatever is left. Because the two percentages stand on different bases, they are not mirror images. The general formula: after a fractional loss d, the gain required to restore the starting balance is d ÷ (1 − d). Lose 20% and the required gain is 0.20 ÷ 0.80 = 25%. The deeper the loss, the smaller the base, and the faster the required recovery grows.
| Drawdown | Capital remaining | Gain required to break even |
|---|---|---|
| −10% | 90% | +11.1% |
| −20% | 80% | +25% |
| −25% | 75% | +33.3% |
| −33.3% | 66.7% | +50% |
| −50% | 50% | +100% |
| −75% | 25% | +300% |
Notice the shape. The left column falls in even steps; the right column accelerates. Between −10% and −20% the required recovery roughly doubles; between −50% and −75% it triples. This is why the asymmetry is arithmetic, not psychology. A trader down 75% does not need more conviction. They need a +300% run merely to be flat, produced by an account holding a quarter of its original capital. No mindset closes that gap; only the surviving capital can, and there is less of it at exactly the moment more is asked of it.
The loss is measured on the capital you had. The recovery is measured on the capital you have left.
Same trades, different order
Sequence risk is often explained carelessly, so let us be precise. Take six trades that each move the account 10%: three winners, three losers. If you risk a fixed fraction of current equity, multiplication commutes: the end balance is the same in every order, 1.1³ × 0.9³ ≈ 0.970, a net loss of about 3% (the drag of volatility itself, even with wins and losses balanced). If you risk a fixed money amount, addition commutes too: three wins and three losses of €100 sum to zero in any order. On paper, the endpoint is order-blind.
The path is not, and the path is what you actually trade through. Start a €1,000 account with the three losses in a row:
- Fixed fraction (risking 10% of current equity): €1,000 → €900 → €810 → €729. The streak costs −27.1%, because each successive loss is taken on a smaller base. Break-even from here needs +37.2%.
- Fixed size (risking €100 per trade): €1,000 → €900 → €800 → €700. The same streak costs −30%, and the constant stake has quietly grown from 10% of equity to 12.5% and rising. Break-even from here needs +42.9%.
Two differences matter. First, fixed-size digs the deeper hole on any losing streak, and each further loss claims a growing share of what remains: the risk per trade drifts upward precisely when the account can least afford it. Fixed-fraction sizing shrinks the stake as equity falls, which is why its streak stops at −27.1% rather than −30%. Second, and decisive under leverage: the endpoint only commutes if you get to the end. A losses-first ordering burns margin headroom early, and a margin close-out can end the sequence before the winning half arrives. The realised outcome then differs from the paper sum, not because arithmetic broke, but because the account was not allowed to finish the path. That survival question, not any change in the final total, is the substance of sequence risk. It is also the core of the case made in Why position sizing beats prediction.
Leverage compresses the clock
Everything above happens faster with leverage. A CFD position controls a notional value many times the margin behind it, so the equity backing the position experiences every price move multiplied by the leverage ratio. At 30:1, a 1% adverse move in the underlying consumes 30% of that position's margin. An unleveraged position needs a 10% price fall to produce a −10% drawdown; at 30:1, a move of a third of one per cent does the same work. The recovery table is unchanged — but the ladder is descended thirty times faster than the price chart suggests.
The regulatory margin floors make this concrete. Under the framework ESMA introduced in 2018 (since written into national rulebooks), a retail CFD on a major currency pair carries a minimum initial margin of 3.33% of notional, which is 30:1 leverage 1. For a single position funded with exactly that initial margin, an adverse price move of about 1.67% of notional consumes half the margin. Half the margin is not an arbitrary marker: it is exactly where the close-out rule stands.
- Minimum initial margin, major FX pairs
- 3.33% (30:1)†
- Margin close-out floor, per account
- 50% of initial margin†
- Retail CFD accounts losing money (NCA studies, 2018)
- 74–89%†
Where the 50% close-out rule stands
In May 2018, ESMA used its product-intervention powers to restrict CFDs offered to retail clients across the EU, with effect from 1 August 2018. Decision (EU) 2018/796 introduced, alongside the leverage caps, a standardised margin close-out: when the funds in a retail client's CFD account plus the unrealised net profits of all open CFDs fall below 50% of the total initial margin required for those positions, the provider must close one or more of them, applied per account, not per position 1. The decision also records why standardisation was needed: national regulators had observed providers letting client funds erode to between 0% and 30% of initial margin before intervening, deep enough that a gapping market could push the account below zero 1. ESMA's measures were temporary and renewed into 2019; national regulators then made them permanent. In the UK, the FCA's PS19/18 applied the same 50% close-out and 30:1-to-2:1 leverage bands from 1 August 2019 3.
Read against the recovery table, the close-out rule does two things. It converts a deep paper drawdown into a realised one: positions are closed around the point where half the initial margin is gone, whether or not the trader believed the move would reverse. The hold-and-hope route to the +100% row is simply not available on a leveraged retail account. At the same time it keeps accounts out of the table's lower rows, where required recoveries turn from difficult to implausible: losses are forced to be taken while capital remains, and negative balance protection caps them at the funds in the account 1. One precision worth keeping: the rule triggers at 50% of the initial margin your open positions required, not at 50% of your balance. An account running small positions relative to its equity can sit far from close-out even during a losing streak; an account fully deployed at maximum leverage lives next to the threshold from the first tick.
What the arithmetic suggests
None of this says what to trade. It says something about how much. The recovery curve is gentle in its first rows and vicious in its last, so the practical question is not "how would I recover from −50%?" but "what sizing keeps a realistic losing streak in the −10% neighbourhood?" Risking a small fixed fraction per trade, with a stop-loss that defines the loss before entry, keeps consecutive losses on the shallow part of the curve, where an ordinary run of winners can plausibly repair them. Three questions worth asking of any strategy: how many consecutive losses is it realistic to expect; what drawdown does that streak produce at your size; and what does the table demand back at that depth? Our education article on position sizing before prediction works through the first two. The table above answers the third.
Free position size, margin and pip value calculators. No account needed.
Run your own drawdown numbers资料来源
本文据以核查的原始文件。
- European Securities and Markets Authority (Official Journal of the EU) Decision (EU) 2018/796 of 22 May 2018 to temporarily restrict contracts for differences in the Union · 截至 2018年5月22日
- European Securities and Markets Authority ESMA agrees to prohibit binary options and restrict CFDs to protect retail investors · 截至 2018年3月27日
- Financial Conduct Authority PS19/18: Restricting contract for difference products sold to retail clients